Bike-Share Project
In Details analysis across Chicago, New York, and Washington.
Analyzing bike-share usage and trends to optimize service across three major cities over a six-month period.
- Technology: Python , Power BI
- Completed: Jan 2023
- Target: Insights and recommendations derived from the analysis to improve bike-share operations and user experience.
Data Preparation
Unified ride data from Chicago, New York, and Washington after extensive cleaning and outlier treatment
to create key statistical insights on total rides, average duration, most popular days/stations/months, and user demographics.
The Datasets
The datasets provided by Motivate, a bike share system provider in the US, contain randomly selected data for the first six months of 2017 for all three cities. Core columns include Start Time, End Time, Trip Duration, Start Station, End Station, and User Type, with Chicago and New York City files also containing Gender and Birth Year.
Power Bi Part
Detailed Insights and Usage
Exploring how the analysis informs business decisions, operational planning, and customer engagement strategies.
First Dashboard: Ride Overview Dashboard
Visualizing total rides, average ride times, and user demographics.
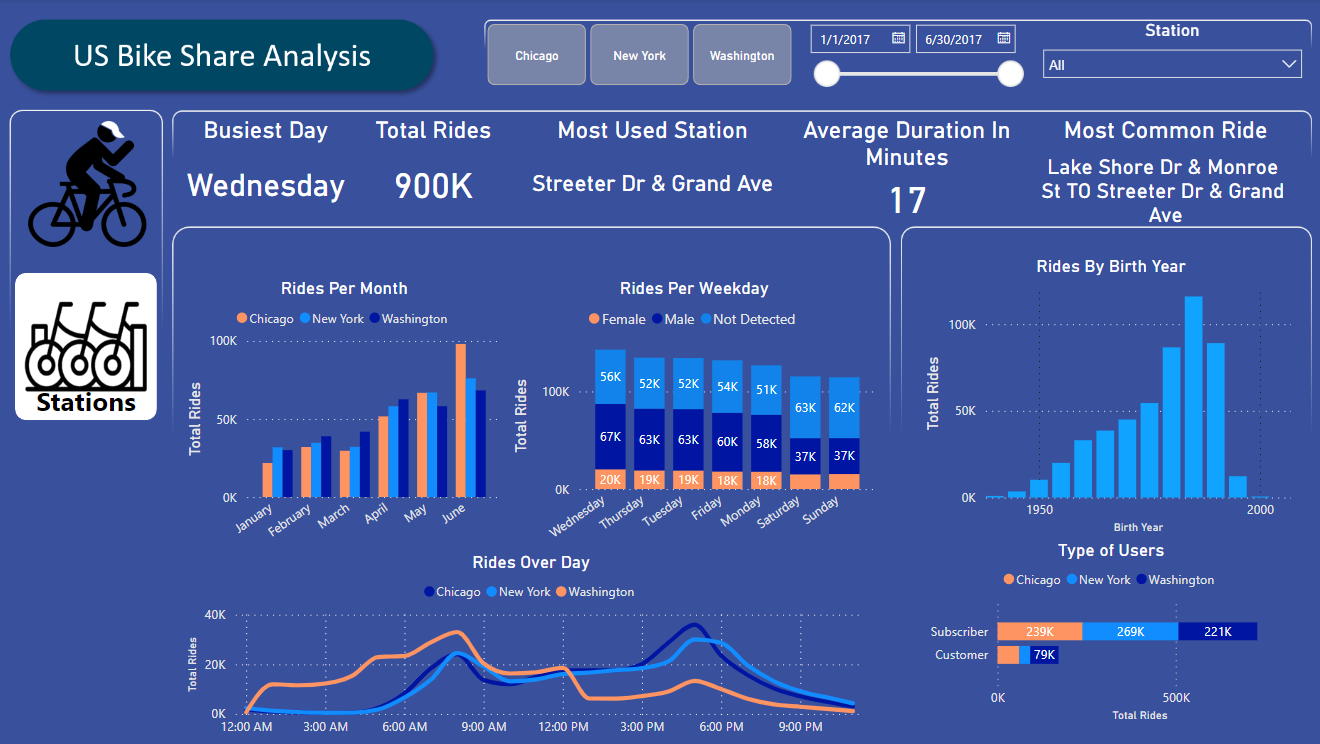
- Total Rides : Indicates demand, guiding capacity planning and fleet management
- Average Ride Duration: Informs pricing strategies and promotional activities.
- Time-based Charts : Helps optimize bike distribution and staffing levels.
- User Demographics: Tailors marketing to target demographics for enhanced engagement.
- Station Analytics : Strategic placement and improvements based on station popularity and user flow.
- Interactive Features : Enables city-specific, temporal, and station-level data analysis for precision planning.
Second Dashboard: Station Analytics
Detailed analytics for station performance including ride frequency and comparative statistics.
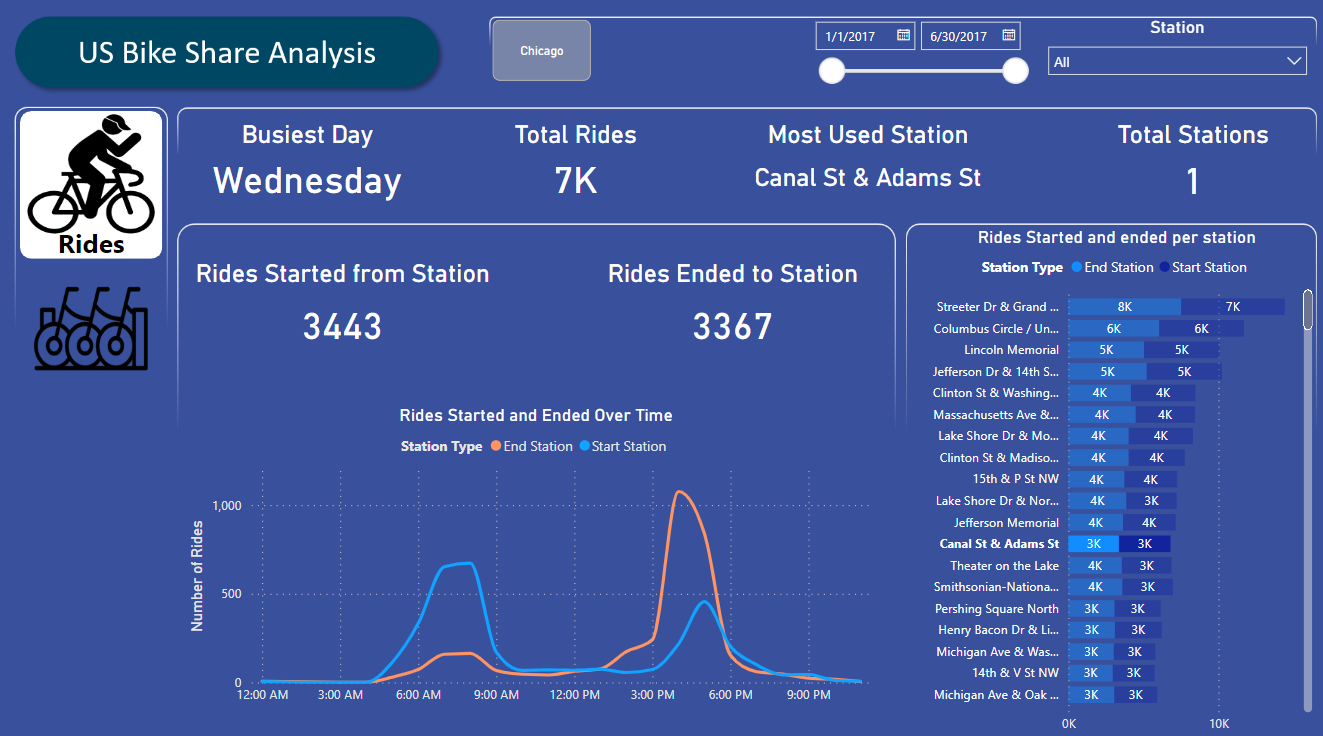
- Busiest Day: Identifies the day with the highest number of rides, useful for resource allocation and operational planning.
- Total Rides: Indicates demand, guiding capacity planning and fleet management.
- Most Used Station: Pinpoints the station with the highest traffic, crucial for maintenance and upgrade decisions.
- Total Stations: Provides a count of stations, informing infrastructure development and expansion strategies.
- Rides Started Station: Measures the station's departure activity, aiding in station staffing and bike supply.
- Rides Ended to Station: Measures the station's arrival activity, assisting in managing bike return and availability.
- Rides Over Time : Displays ride activity patterns throughout the day, helping to predict peak times and optimize bike rotation.
- Rides Started and Ended per Station : Compares departure and arrival activity across stations, essential for balancing bike distribution.
Python Part
Overview
Explore data related to bike share systems for three major cities in the United States—Chicago, New York City, and Washington.
Using Python, write code to import the data and compute descriptive statistics,
and create an interactive experience in the terminal to present these statistics.
Answering Questions
Through writing code, answer questions about the bike share data such as the most common month,
day of the week, and hour for rides to start; total and average trip duration; most frequently used stations;
user types; gender counts; and birth years.
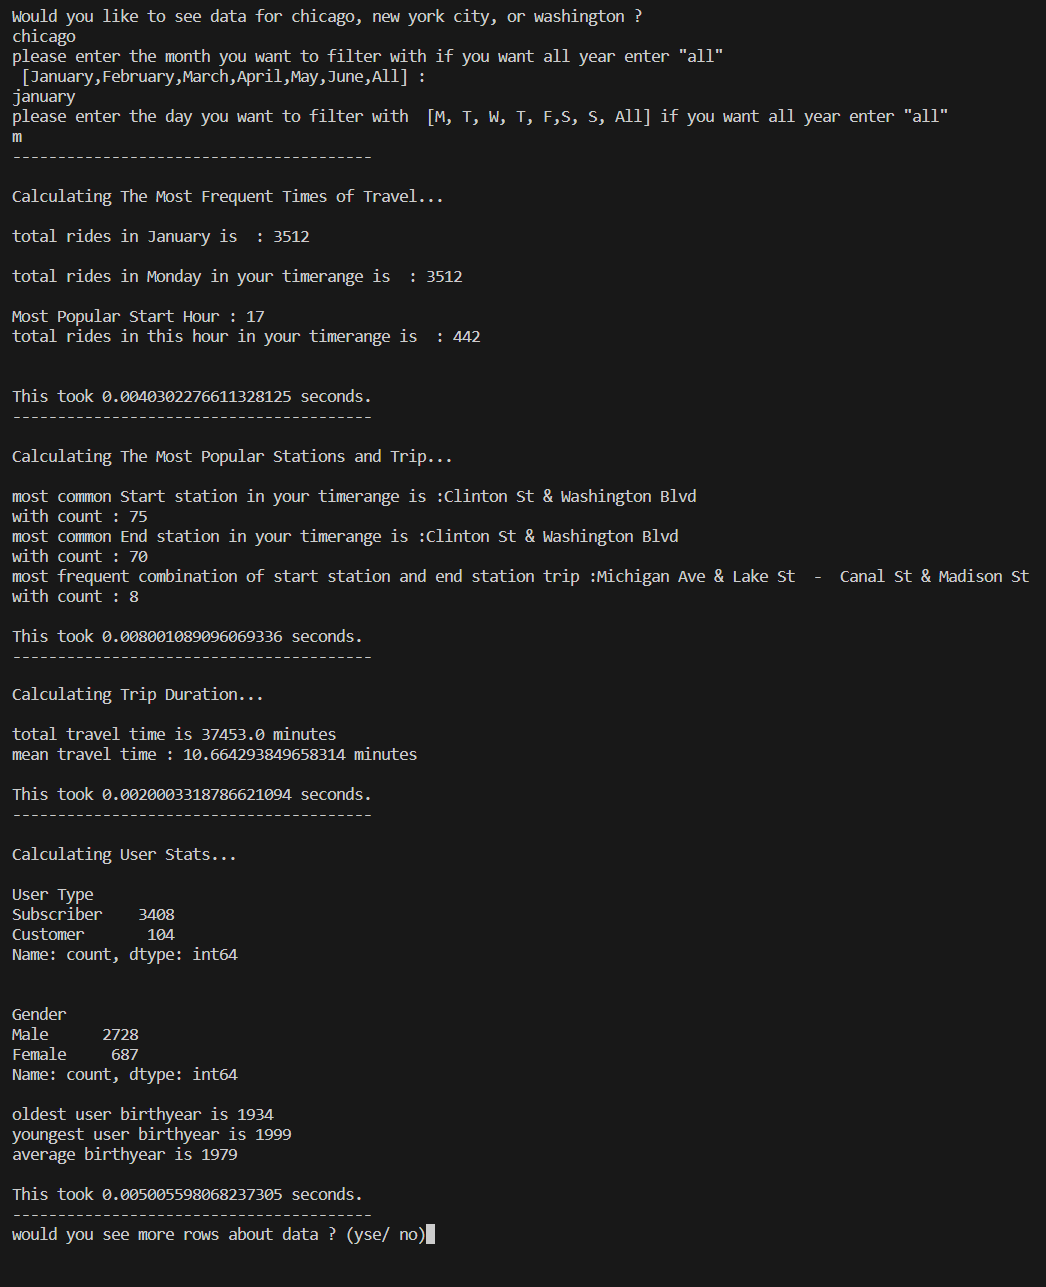
The Interactive Experience
For a more interactive experience, I wrote a script that took raw input in the terminal to present the statistics.
Below screenshots show the results after requesting for information in Chicago for the month of January on Monday :