Spotify Streams analysis
Designed and developed an in-depth Spotify Music Analysis dashboard, showcasing interactive data visualizations of streaming trends and artist performance metrics in 2023, and provided strategic market insights derived from in detailed data analysis process.
- Technology: Power BI
- Completed: Feb 2023
- Target: offering strategic recommendations for artists and producers, suggesting optimal release times and potential collaborative opportunities to maximize streaming potential.
Data Preparation
Collected streams data for the year 2023.
Data cleansing for accuracy and consistency, ensuring reliable analysis.
Detailed Insights and Usage
An in-depth exploration of Spotify's streaming data to uncover music trends and artist impact in 2023.
Comparative analysis across two interactive dashboards, highlighting track streams, artist performance, and market dynamics.
First Dashboard: Streams Overview Dashboard
Visualizing charts for Streams, artist songs, releases and dates of tracks .
This dashboard presents a visual analysis of Spotify music streaming trends, providing insights into total streams, average streams, and the total number of tracks released. It also features a line chart of total streams by release dates, a table of total streams each month, and another chart showing daily streams. Detailed information on the most streamed song and a list of the top 5 songs in terms of streams are also highlighted.

- Total Streams: Reflects the artist's reach and engagement, essential for marketing and promotional strategy.
- Average Streams : Provides insights into track popularity, useful for artist exposure and platform recommendation algorithms.
- Streams by Release Dates: Tracks the success of music over time, aiding in the analysis of trends and artist development.
- Streams by Month: Identifies seasonal listening patterns, beneficial for timing release strategies.
- Daily Streams: Reveals listener habits by day, guiding content release and engagement tactics.
- Artist's Most Streamed: Highlights top-performing tracks, directing focus for advertising and radio play.
- Number of Playlists : Indicates a track's inclusion across platforms, reflecting its ubiquity and cross-platform success.
- Most Streamed: Visually represents the most successful tracks, enhancing user interaction with popular content.
Second Dashboard: Artists Analytics
Detailed analytics for artists performance including total streams and number of tracks for each and high impact artist and comparative statistics.
This dashboard presents a visual analysis of Spotify music streaming trends, providing insights into total streams, average streams, and the total number of tracks released. It also features a line chart of total streams by release dates, a table of total streams each month, and another chart showing daily streams. Detailed information on the most streamed song and a list of the top 5 songs in terms of streams are also highlighted.
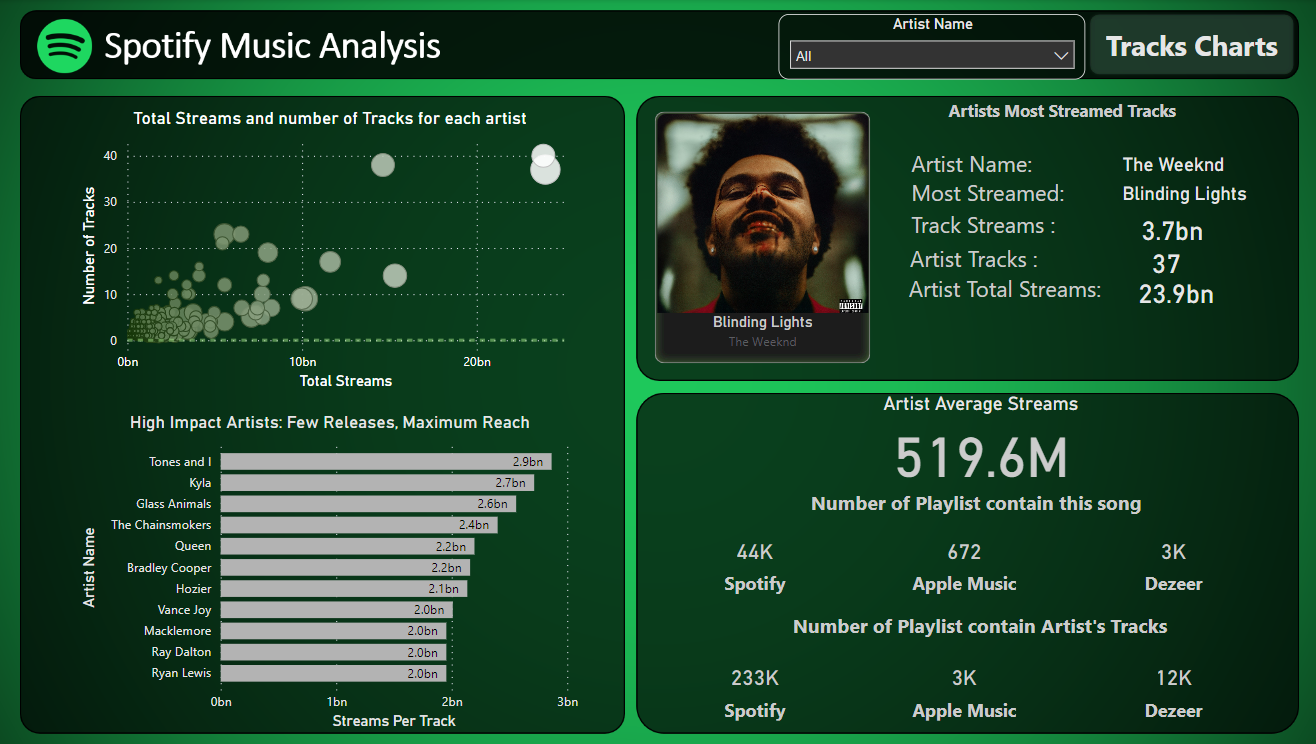
- Streams and Tracks for Artists : Demonstrates the artist's catalog performance, informing decisions on production and promotion.
- High Impact Artists : Identifies artists with high efficiency in streams per track, useful for talent scouting and artist management.
- Artists Streamed Tracks : Summarizes streaming success, useful for benchmarking and setting performance targets.
- Artist Average Streams: Averages streams per track, indicating the consistent popularity of an artist's work.
- Number of Playlists : Shows an artist's playlist presence, informing collaborative marketing efforts and platform relationships.
From the data presented, we observe peak streaming times, identify standout artists, and compare stream counts. The analysis reveals that certain artists maintain high streaming numbers with fewer tracks, indicative of high-impact releases.