HR Analysis Project
provide in Target insights into the HR data of an organization. The dashboard leverages data visualization to assist HR professionals in making informed decisions.
- Technology: Power BI
- Completed: Feb 2023
- Target:
Offer a clear overview of key HR metrics
Enable detailed analysis of employee demographics and salary distributions.
Identify trends in employee turnover and retention rates.
Facilitate data-driven decision-making to improve HR strategies.
Data Preparation
The data was curated from a HR dataset, which included a variety of attributes such as personal information,
job details, salary data, and employment history.
Data Transformation
- Derived Metrics: Calculated additional metrics, such as tenure, promotion rate, and salary growth over time.
- Categorization: Segmented data into relevant categories for more further analysis.
- Aggregation: Summarized data at various levels to facilitate high-level insights.
Detailed Insights
The dashboard provides a multitude of insights, derived from in-depth analysis of the data:
- Workforce Composition : Detailed demographic breakdown, revealing diversity in age, gender, and ethnicity.
- Turnover Trends : Insights into patterns of employee attrition, with focus on high-risk departments and positions.
- Salary Analysis : Advanced review of salary structures, uncovering disparities and opportunities for remuneration adjustments.
- Performance Metrics : Evaluation of employee performance ratings in relation to compensation, position, and department efficiency.
- Hiring and Retention : Analysis of hiring trends over time and the success rate of retention strategies across different business units.
landing page
simple navigation buttons and icons
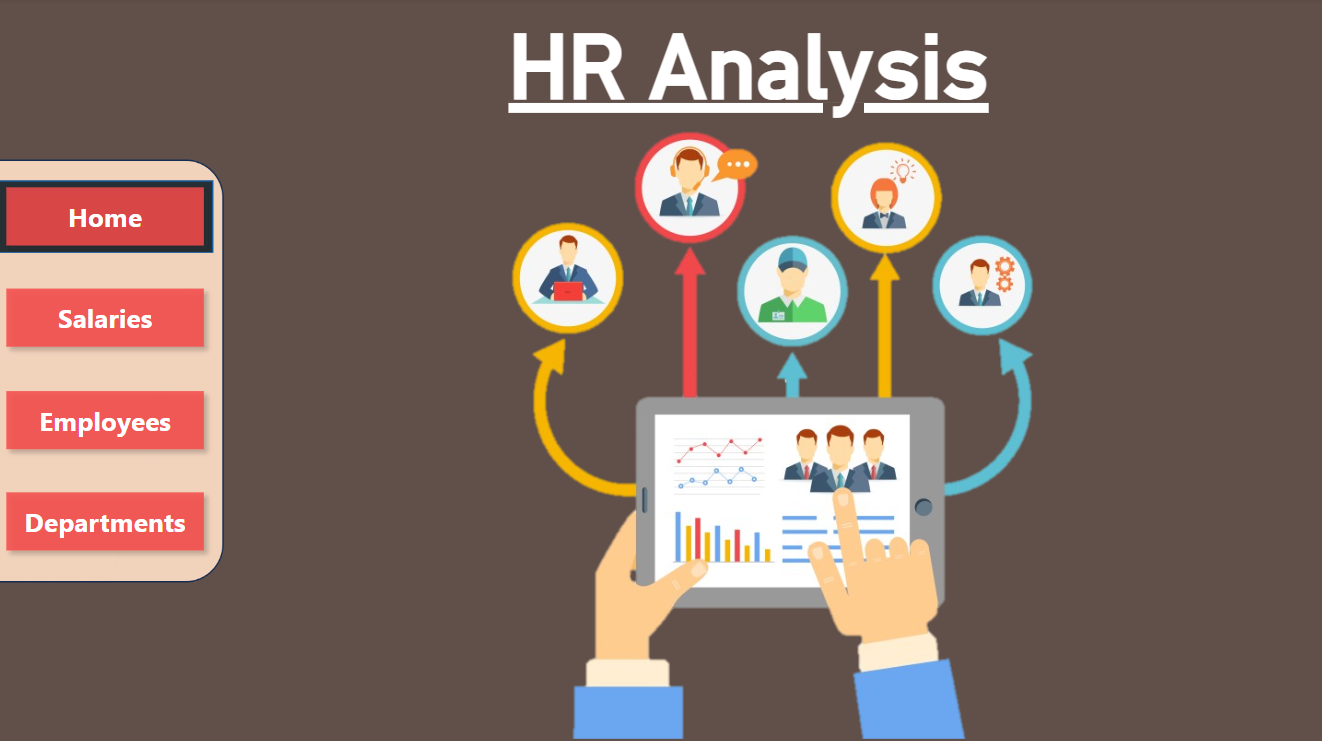
just to have simple navigation that serves the porpuse of the user
First Dashboard: employees
Detailed analytics for employees statues including turnover frequency comparative statistics about the distribution of employees over business units.
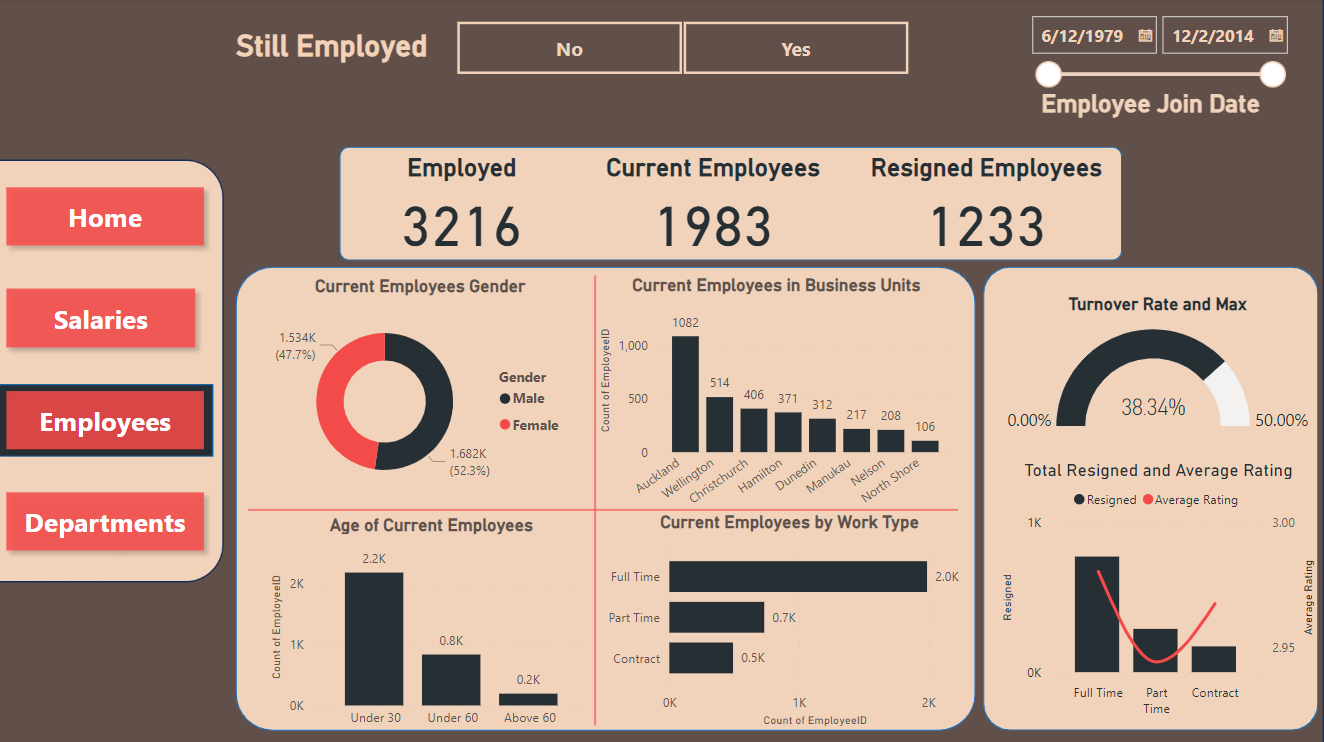
The Employee Composition and Turnover Dashboard serves as the central hub for understanding the workforce's demographics and movements. It features the total number of employees, categorized by their employment status — whether they're currently employed, new joiners, or those who have resigned. The dashboard visually breaks down the gender distribution, age brackets, and displays turnover percentages, offering immediate insight into the workforce's current state and dynamics.
Second Dashboard: Salaries
Detailed analytics for Salaries of employees including turnover comparative statistics about the distribution of financal flow over business units.
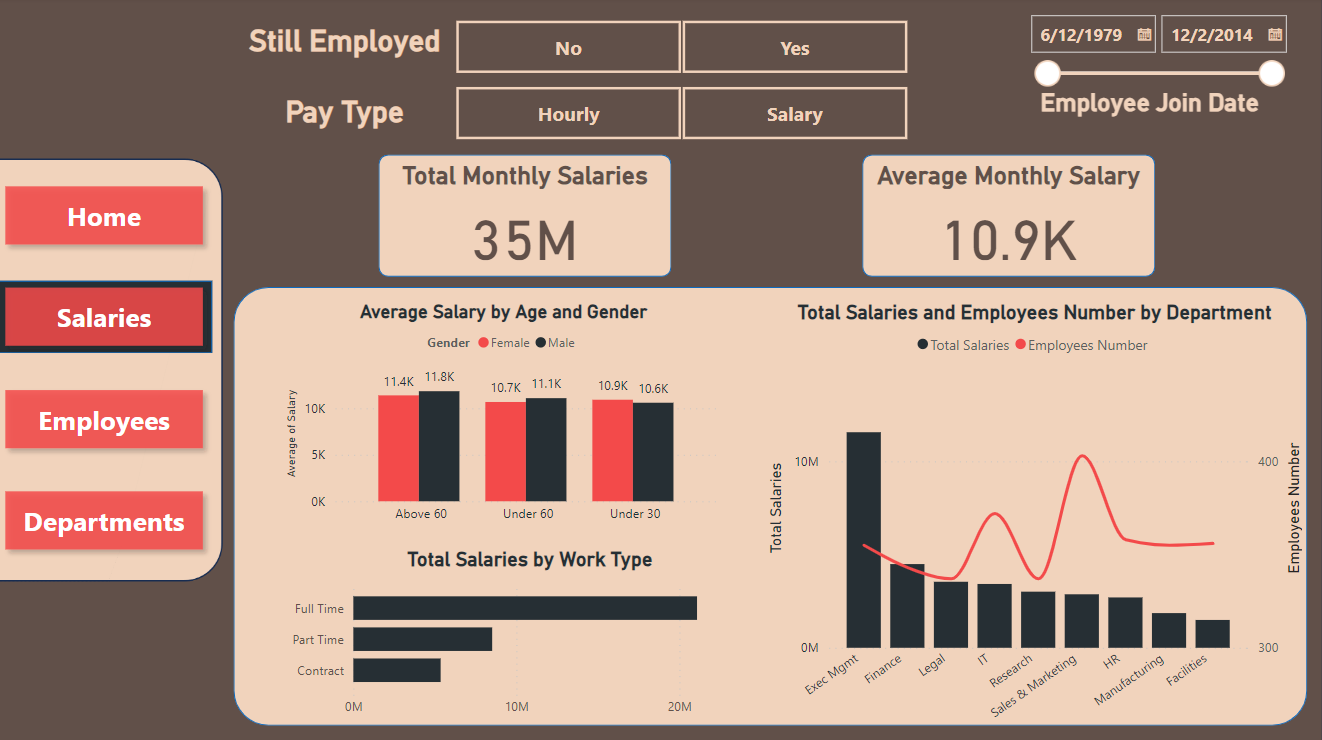
The Salary Overview Dashboard offers a thorough examination of the salary distribution within the company. It highlights the total monthly salaries and average salary per employee, segmented by age and gender. Additionally, it provides insights into the total salaries by work type and the number of employees per department, crucial for financial planning and ensuring equitable pay across the organization.
third Dashboard: departments
Tree shows the structure of the company based on business unit cost center and group.
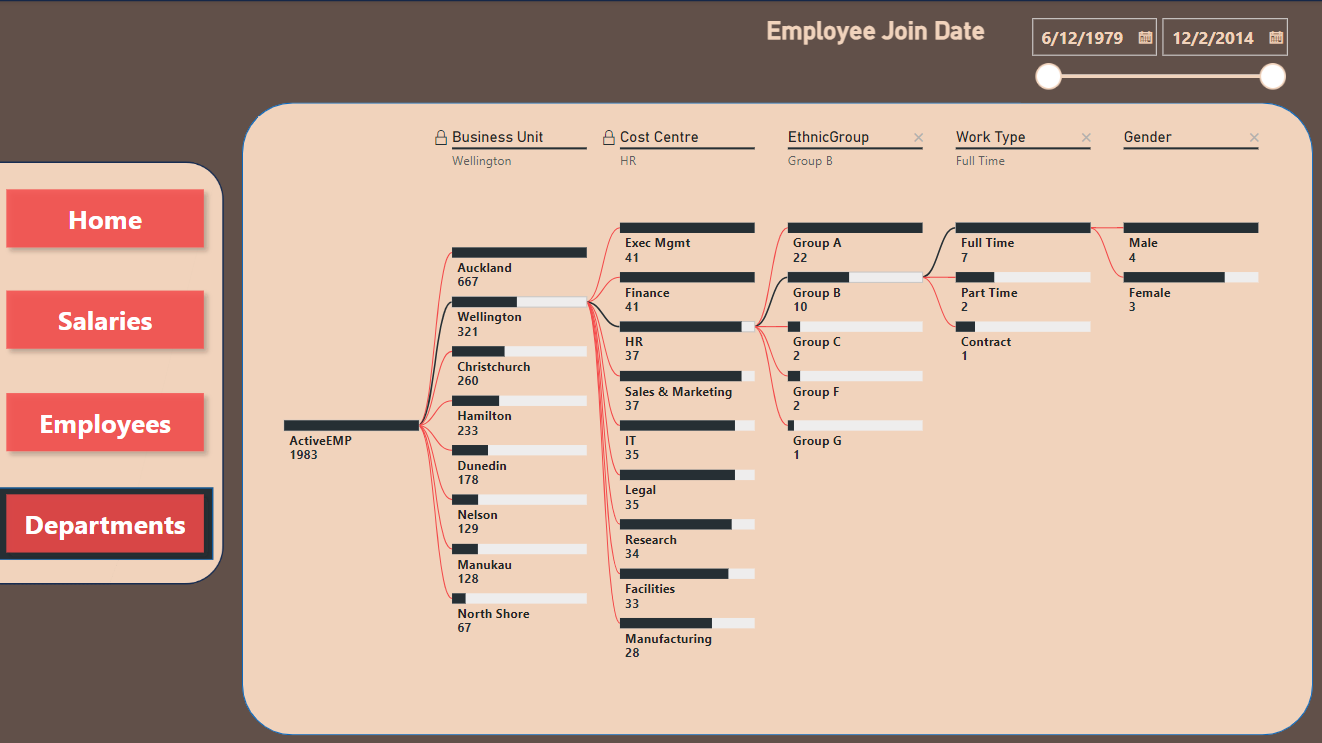
The Departmental Analysis Dashboard provides a detailed look into the distribution of employees across various business units and departments. It allows users to filter by business unit, cost center, ethnic group, work type, and gender, giving a comprehensive view of the company's structural composition. This layer of the dashboard is essential for analyzing workforce allocation and identifying areas that may require rebalancing or further investigation.