
Revenue Analysis Project
This project provides comprehensive insights into the revenue data of mobile operators in Egypt and the UAE. The dashboard leverages data visualization to assist business professionals in making informed decisions.
- Technology: Power BI
- Completed: May 2024
- Target:
Offer a clear overview of key revenue metrics
Enable detailed analysis of revenue per service and country
Identify trends in revenue over time (weekly, monthly, yearly)
Facilitate data-driven decision-making to optimize business strategies.
Data Preparation
The data was curated from a revenue dataset, which included attributes such as mobile operator, amount, date, and service.
Data Transformation
- Currency Conversion: Converted revenue amounts into USD based on the conversion rate at the month of each transaction.
- Revenue Calculation: Calculated net revenue by applying specific revenue shares for each country (Egypt: 60%, UAE: 50%).
- Aggregation: Summarized data at various levels to facilitate high-level insights.
Detailed Insights
The dashboard provides a multitude of insights, derived from in-depth analysis of the data:
- Revenue Per Mobile Operator: Visualizes net revenue per mobile operator, with differentiation by country.
- Revenue Per Service and Country: Shows net revenue for each service, split by country.
- Revenue Trends: Analyzes revenue trends over different time periods (weekly, monthly, yearly).
- Overall Metrics: Displays total net revenue, average net revenue per service, and average daily revenue.
Revenue Dashboard
Detailed analytics for revenue distribution, trends, and insights.
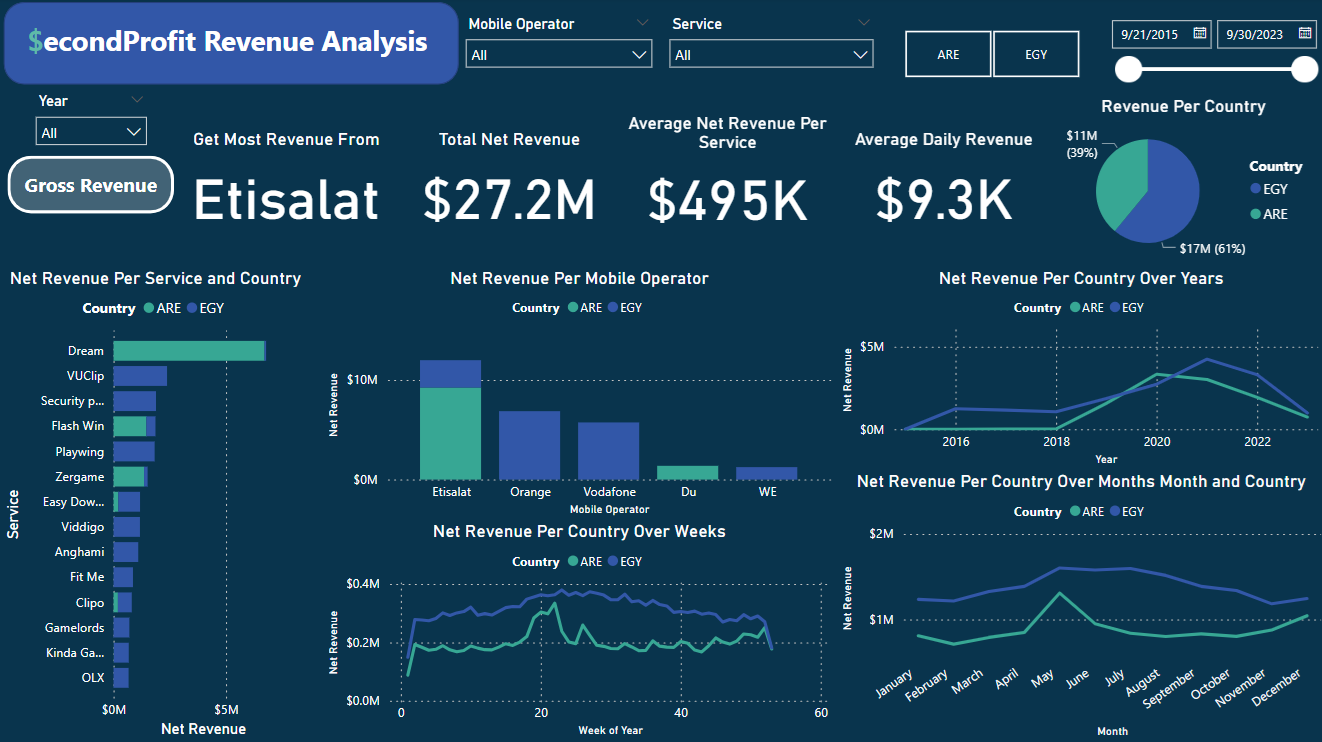
The Revenue Dashboard serves as the central hub for understanding the revenue distribution and trends. It features total net revenue, revenue per mobile operator, service, and country, and revenue trends over time. The dashboard visually breaks down revenue metrics, offering immediate insight into the revenue's current state and dynamics.